


Energy Management in Practice: How INTERA TP Reduces Electricity Costs and Increases Energy Independence
How to reduce electricity costs with Energy Management?
Every day we witness great turbulence in the energy market, while electricity as the basic driver of the modern economy is continuously increasing in price.
Therefore, the need for sustainable and efficient energy management has become an indispensable element of the competitiveness of today’s companies.
Energy management is no longer seen only as a tool for reducing costs, but as a strategic approach that enables organizations to be more energy independent, adaptable and reduce environmental impact.
The development of renewable energy sources, energy storage systems and advanced digital technologies has opened up new opportunities for optimizing electricity consumption. However, the real value of such systems comes not only from the onboard equipment, but from the ability to connect all elements into a single, intelligently controlled whole.
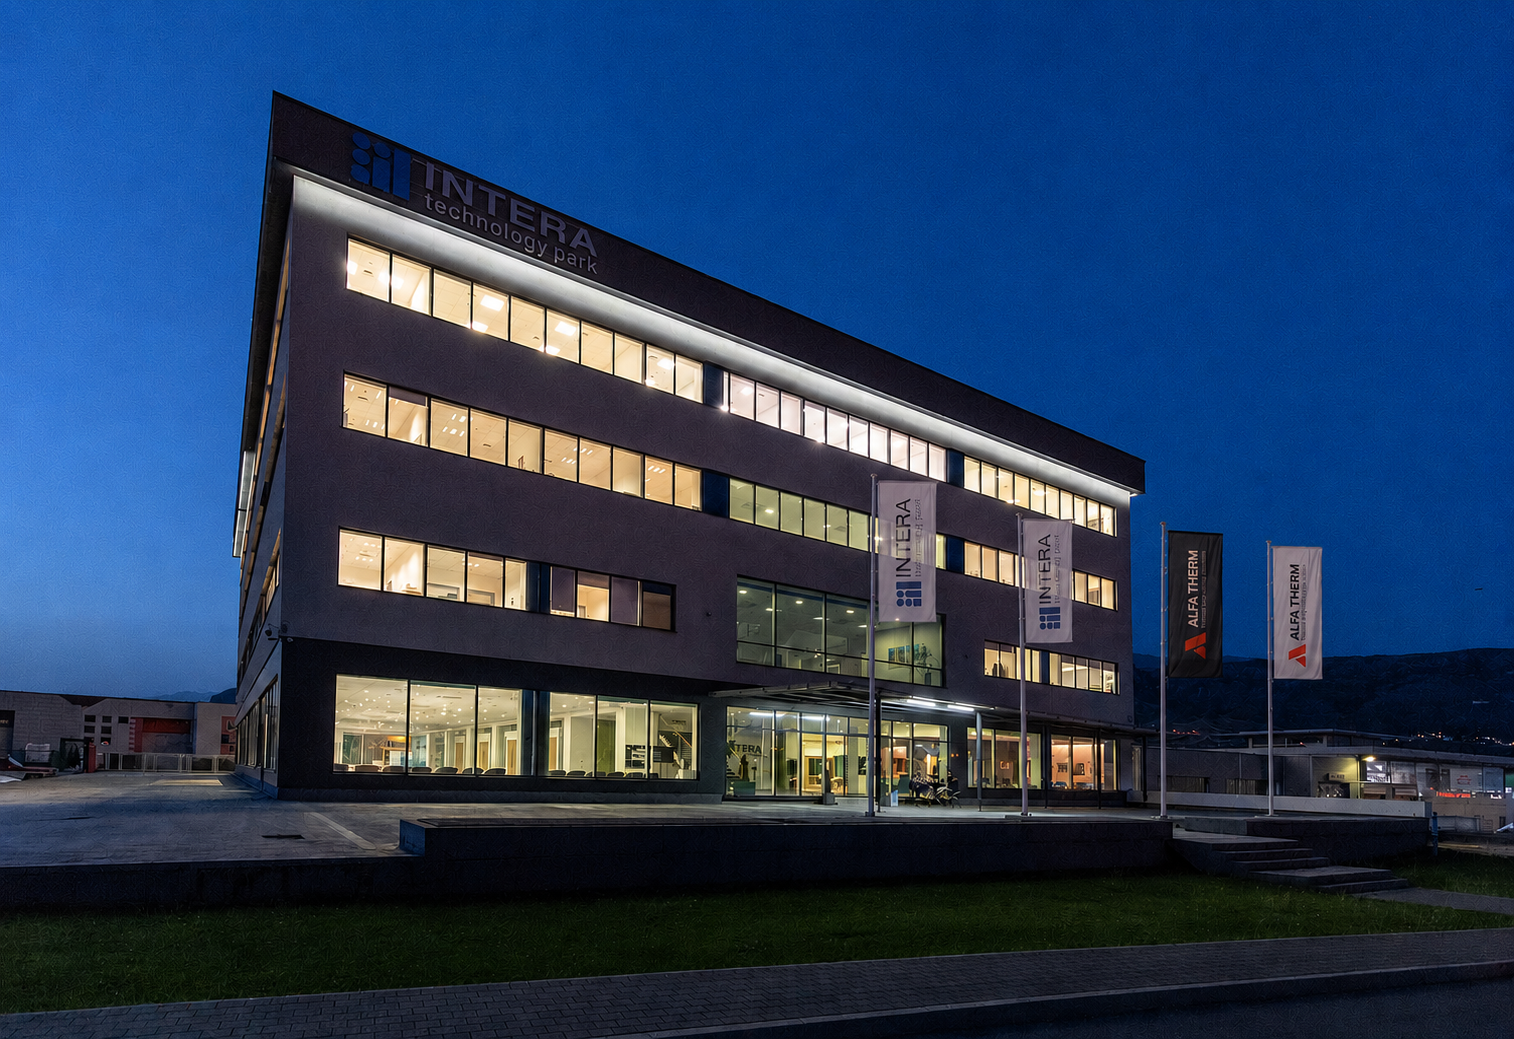
This is exactly the approach our company has applied in Intera Technology Park by implementing an advanced energy management system. The project shows how the combination of a photovoltaic power plant, a battery system and its own Energy Core software based on artificial intelligence can achieve greater energy independence, with a significant reduction in costs and an increase in environmental sustainability.
There is an overview of the implemented solution, the technologies that control it, and how artificial intelligence and the battery system together create concrete energy and financial savings.
Energy Management System implemented in INTERA TP
Our unique Energy Management model in real conditions was demonstrated in the INTERA Technology Park. The implemented solution combines the production of electricity from renewable sources, energy storage and intelligent demand management.
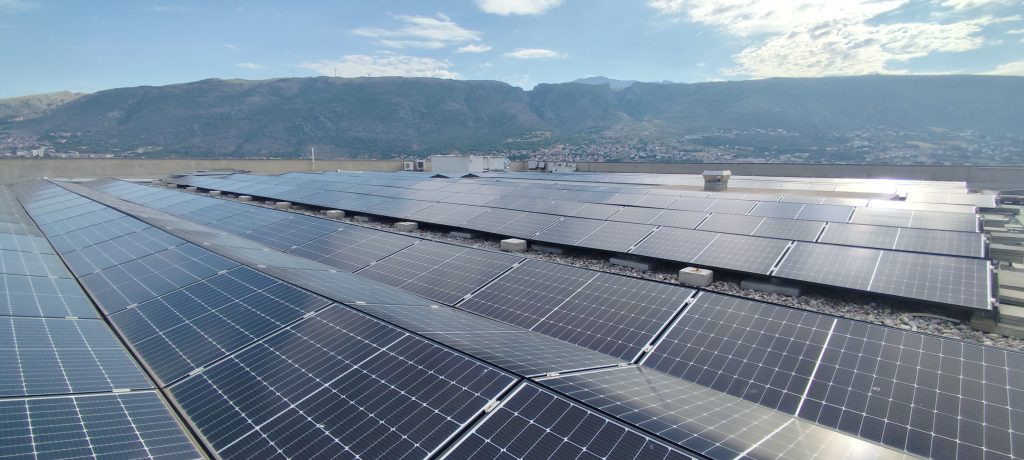
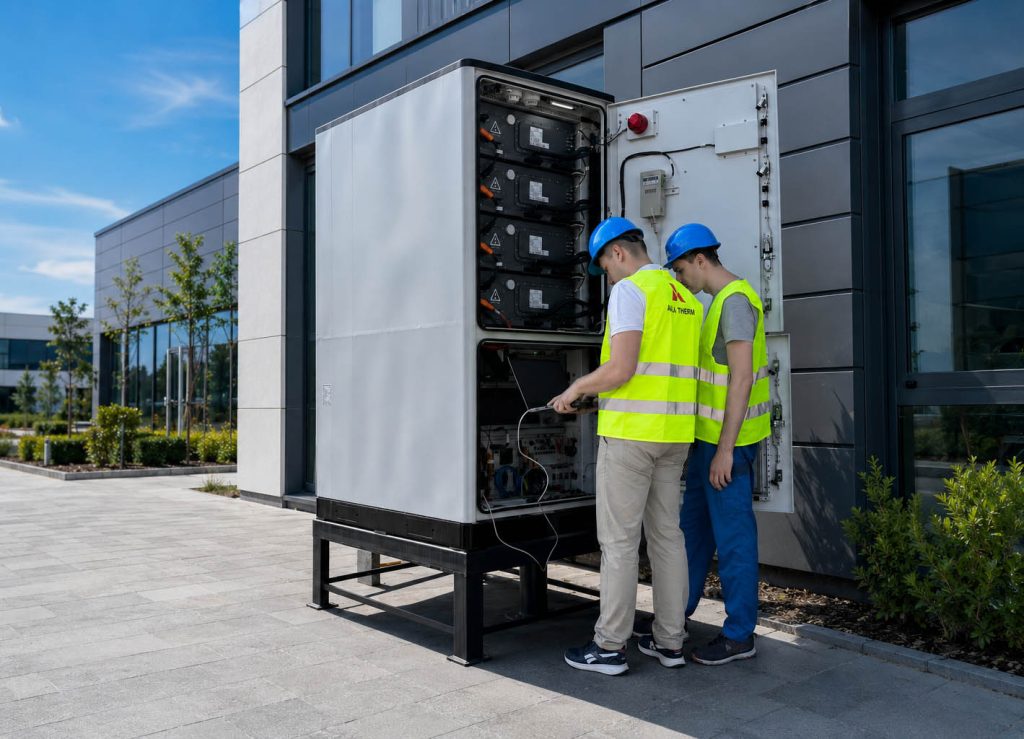
The system consists of a photovoltaic power plant with an installed capacity of 158 kWp and a Fox G-Max battery system with a capacity of 100 kW and a capacity of 215 kWh. While a solar power plant produces energy from renewable sources, a battery system allows it to be stored and used at times when electricity from the grid is most expensive. The power of the battery system of 100 kW refers to the maximum charge and discharge power, which means that the battery can be charged or discharged in 2 hours.
This system is designed to last for 10 years with two complete daily charge and discharge cycles, and its modularity allows the connection of up to 8 units, reaching a maximum capacity of an impressive 1.7 MWh. The modularity of the system means that Alfa Therm can scale the battery capacity depending on the growth of the building’s needs, which ensures long-term flexibility and adaptability to changes in the energy market.
However, the real value of a project is not in the equipment itself, but in the way all the elements are connected and optimized. That is why the key component of the system is EnergyCore, our own software platform developed within Alfa Therm, using only the internal knowledge and our engineers’ resources.
Energy Core is developed as a real-time energy management platform and represents the operational center of the entire system. The software consists of three interconnected levels:
- The backend service continuously collects data from the main meter, solar power plant and battery system via Modbus communication. All information is stored in a database, while the system simultaneously collects meteorological data and solar irradiation predictions for the following days. Based on this information, the backend service calculates the optimal operating parameters of the battery system every few seconds and automatically makes charging and discharging decisions.
- The AI machine learning model is developed, based on multi-year measurements of electricity production and consumption. The model continuously analyzes the historical patterns of system behavior and predicts the future production of the solar power plant and the energy needs of the facility. As the amount of available data increases, the model becomes more accurate and allows for additional optimization of the system’s operation.
- The frontend interface provides users with a clear and intuitive overview of all energy flows between the grid, solar power plant, battery and building. In addition to monitoring the current state of the system, users have insight into realized savings, costs, historical trends and future predictions, which makes energy management transparent and simple.
It is the combination of these three layers that transforms the classic battery system into an intelligent energy platform capable of independent decision-making and continuous optimization of electricity costs.
Tariff models as the basis for optimization
A two-tariff electricity billing model is applied for the INTERA TP building.
Summer time
- Higher daily rate from 08:00 to 14:00 and from 17:00 to 23:00
- Lower daily rate from 23:00 to 08:00, from 14:00 to 17:00
Winter time
- Higher daily rate from 07:00 to 13:00 and from 16:00 to 22:00
- Lower daily rate from 22:00 to 07:00, from 13:00 to 16:00
It is important to emphasize that the price of electricity in the higher tariff is approximately twice as high as the price of energy in the lower tariff. Definitely, this difference presents the business logic principle of the EnergyCore system.
The goal is not just to produce or store energy, but also to ensure that it is used at moments when it brings the greatest financial benefit. That is why EnergyCore continuously analyzes production, consumption and the tariff model to determine the optimal moment for charging or discharging the battery system.
Backend service
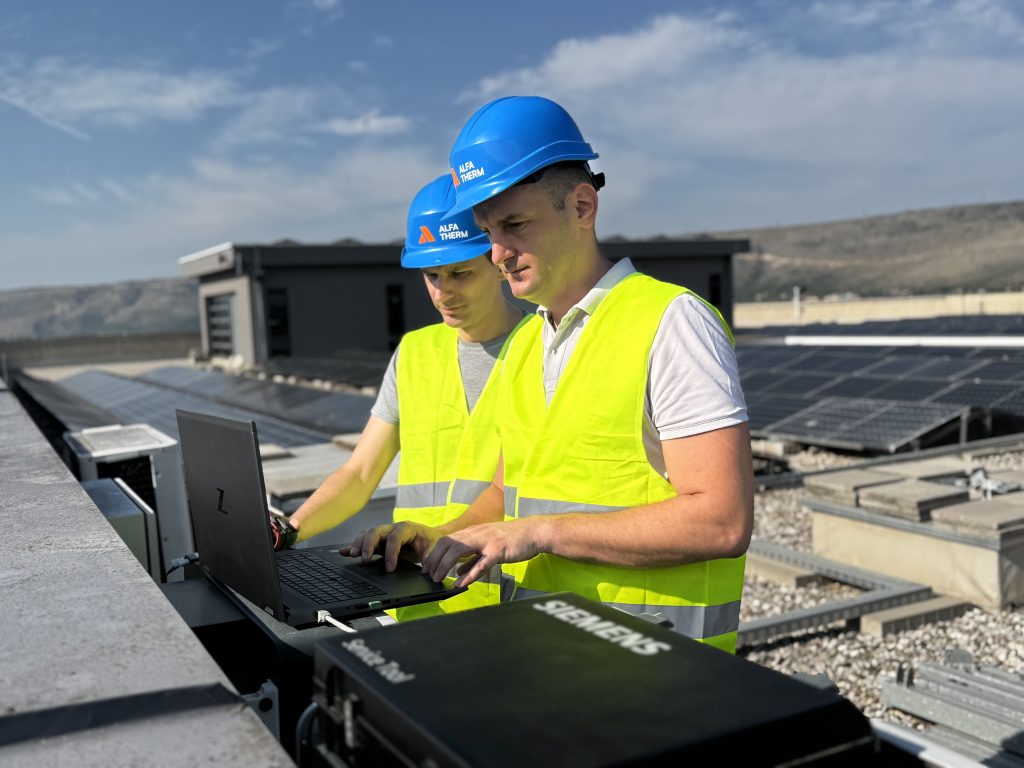
The backend service is the operating brain of the energy management system. Its main task is to continuously collect, process and make decisions according to data from the micro-energy network. It works in real-time and connects all the key components; meters, a battery system, a photovoltaic power plant and an AI prediction model.
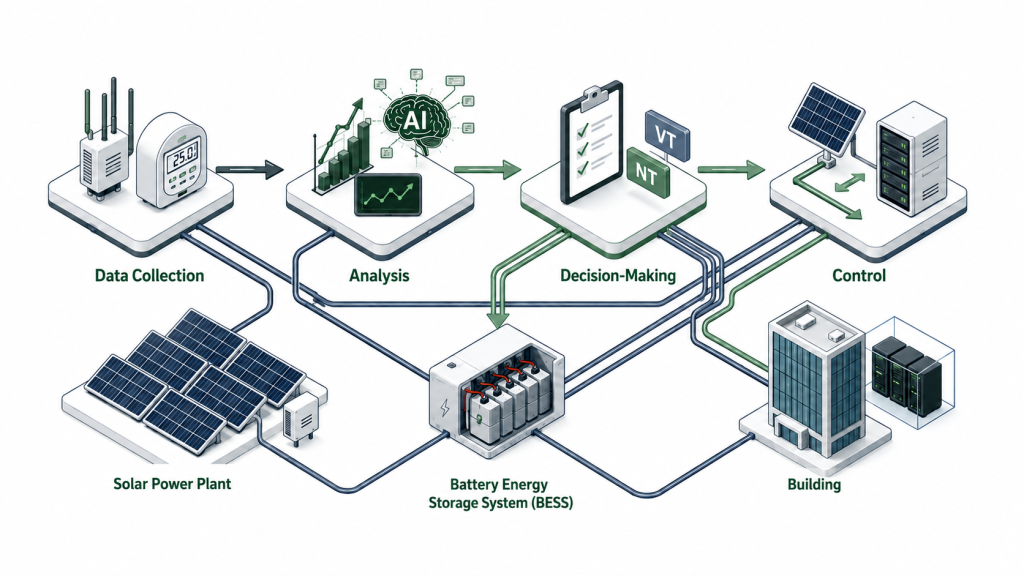
Architecture and functionality:
- The service was developed as modular application that consists of several parallel processes: data collection, analytics, optimization and communication with devices.
- Communication with physical devices takes place via the Modbus TCP/IP protocol, which enables fast and reliable exchange of information between the meter, inverter and battery system.
- All data is stored in related database, structured to allow historical analyse, AI model training and system performance monitoring.
- The backend executes a full cycle every 10 seconds:
- It gets current data on production, consumption, and battery status.
- It analyses them in the context of the tariff model and the weather forecast.
- It calculates the optimal battery operating point (setpoint).
- It sends a command to the battery system to charge or discharge.
Integration with the AI ML model:
- The backend uses predictive solar irradiation (GHI) data which is retrieved from the Open Meteo service.
- Based on this data and historical measurements, the AI model predicts production and consumption for the coming hours and days.
- The backend then compares these predictions with the tariff schedule and makes dynamic decisions about the battery charging strategy (maximum, partial or delayed charging).
Safety and reliability:
- The system has built-in anomaly detection mechanisms. If there is a deviation in the measurements, the backend automatically switches to safety mode.
- All data is archived and can be analyzed retroactively, which enables energy forensics and algorithm optimization.
Visual console and monitoring:
- In the backend service console, key parameters are displayed: current solar power, battery status, building consumption, tariff zone and active optimization strategy.
- Operators can see in real time how the system reacts to changes – for example, a shift from a lower to a higher tariff or a evident drop in solar production.
- The system automatically generates daily and monthly reports on battery savings, consumption, and efficiency.
Backend service is not just a technical component, but an intelligent controller that allows the entire system to function, react, learn and adapt as an organism. Thanks to its speed and precision, Alfa Therm can optimize consumption, reduce costs and increase the utilization of renewable energy sources in real time.
Artificial Intelligence in Energy Management: Predicition and Machine Learning
At the heart of our management is an AI ML prediction model based on machine learning and historical data that has been collected over the past years. The prediction of solar production is made in relation to GHI (Global Horizontal Irradiation) – solar irradiation, for each day and each hour of the year separately.
The AI ML model is used instead of the classic calculation for 2 basic reasons:
- We have a specific photovoltaic power plant on the roof, where part of the panel is facing east, part to west and part to south. In addition, there is a house and a parapet on the roof of the building that make specific shadows depending on the season and hour of the day, which makes the calculation in the classic way difficult, complex and with questionable accuracy
- The AI ML model automatically takes into account the developing of photovoltaic panels over the years
As time passes with the arrival of new measurement data, the AI model learns more and gives better predictions of electricity consumption and production in a building.
As part of the algorithm development, the system successfully uses multiple regression models, whereby a set of regression models (which ensures high prediction accuracy) optimized for this dynamics was applied to optimize the dynamics of this building.
To retrieve GHI forecasts for the upcoming period, we use data from a relevant meteorological web service.
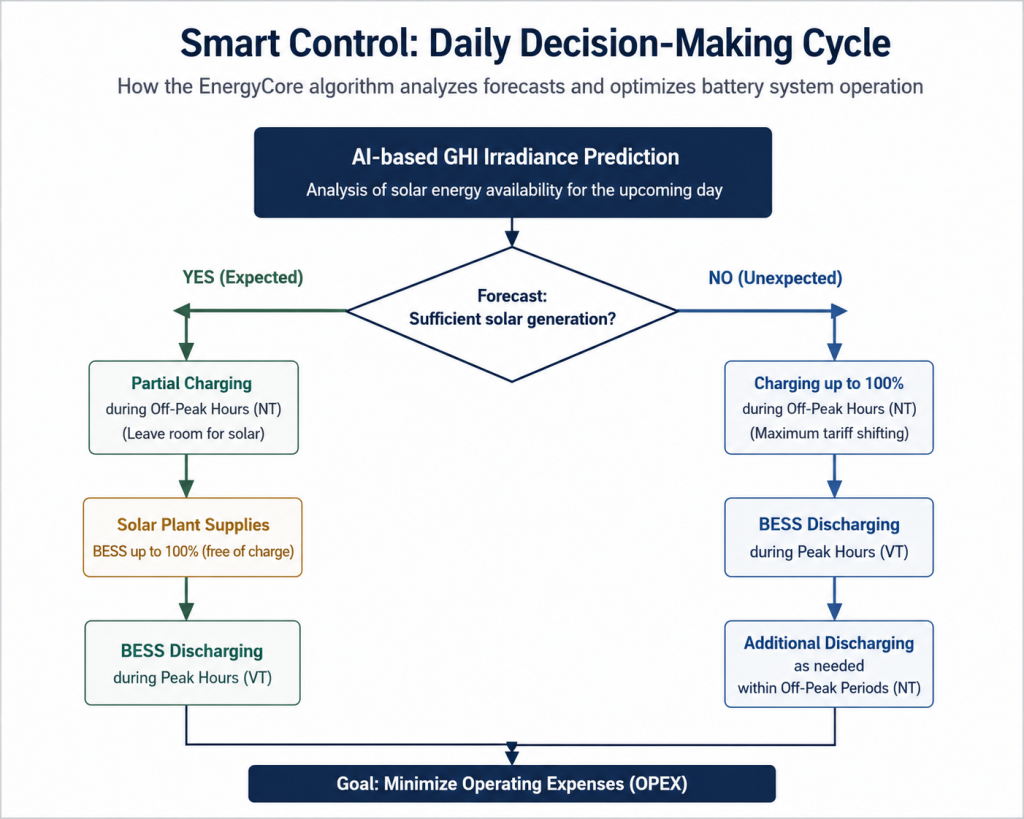
How Does an Energy Management System Automatically Optimize Electricity Consumption?
Our EnergyCore software system doesn’t just work based on current reading. It uses algorithms to make decisions depending on the weather forecast and expected solar irradiation (GHI). The key to success lies in adapting battery charging strategy with two basic scenarios:
1.Strategy at low solar irradiation (Cloudy days)
When the prediction model (purple line on the graph) signals that there will not be enough sun to cover the building’s needs the next day, the system activates the maximum storage mode:
- Overnight charging up to 100%: The battery is fully charged at a lower rate during the night.
- Discharge priority: All stored energy is used exclusively during the hours of the high tariff to avoid buying expensive electricity as much as possible, since solar panels will not be able to make a significant contribution.
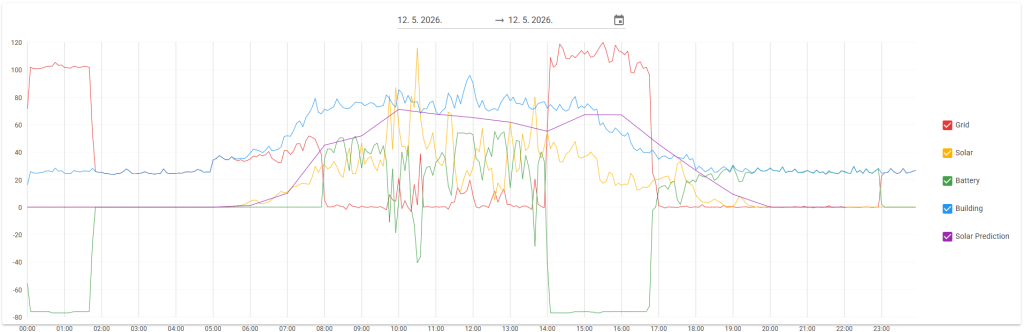
From the diagram, it is evident that the AI model predicted the production from the solar power plant to be lower than the building’s needs. Based on this, the first optimization strategy was chosen, which requires charging the battery at a lower daily tariff to maximum capacity (part of the diagram from 00:00 to 02:00).
During the day, the battery is discharged at a higher daily rate according to the needs of the building (part of the diagram from 08:00 to 14:00). After the lower daily tariff started again, the backend service (the backend computer system that manages the devices and makes decisions) gave the order to the battery to recharge to its maximum capacity (part of the diagram from 14:00 to 16:45). In the higher daily tariff, the battery discharge is restarted in order to minimize the cost of the higher tariff (part of the diagram from 17:00 to 23:00).
2. Strategy at high solar irradiation (Sunny days)
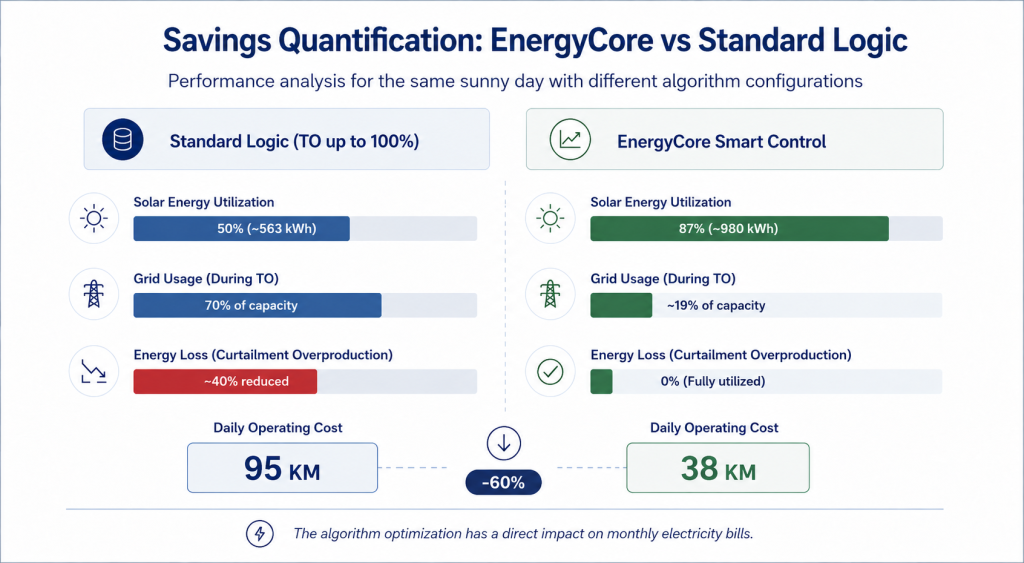
This is the most advanced part of our system that prevents unnecessary costs and energy waste. If the prediction shows a high GHI, the backend service calculates a reduced setpoint of charging:
- Partial Overnight Charging: The battery is not charged to full capacity at night, but only as long as necessary to bridge the early morning period of the high tariff by the time the solar power plant takes over the load.
- Leaving “space” for the sun: By leaving free capacity in the battery, we allow the system to fully absorb the free excess energy from the photovoltaic power plant during the day. If the battery was 100% full in the morning, we would have nowhere to store the excess solar energy.
- Double savings: With this approach, we save on the purchase of grid energy even at a lower tariff and ensure that every solar kWh produced remains inside the building
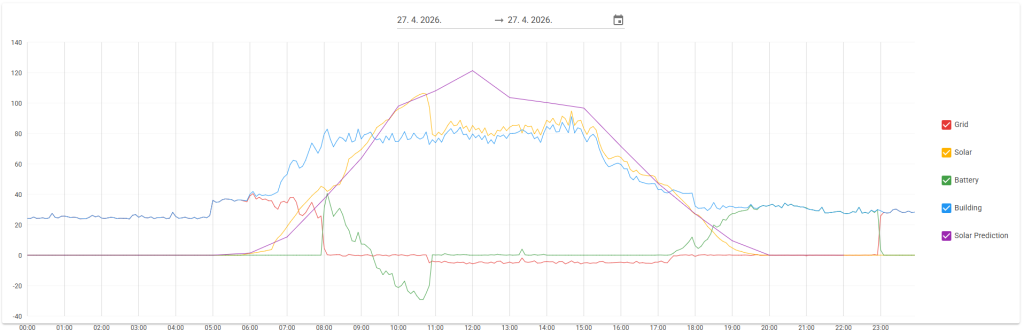
From the diagram, it is evident that the AI model predicted the production from the solar power plant greater than the needs of the building.
Based on this, a second optimization strategy was chosen, which requires charging the battery at a lower daily rate to the minimum required capacity to meet the needs of the building in the first morning hours when there is not yet enough production from the solar power plant.
During the day, the battery was discharged at a higher daily rate according to the needs of the building (part of the diagram from 08:00 to 9:30), while the photovoltaic power plant did not take over the complete consumption of the building. The excess energy from the solar power plant was then used to charge the battery to its maximum capacity (part of the diagram from 09:30 to 11:00).
As the solar power plant met the complete energy need of the building and the battery, there was no need to charge the battery in the second part of the day when the lower tariff occurred. In the higher daily tariff, the battery discharge is restarted in order to minimize the cost of the higher tariff (part of the diagram from 17:00 to 23:00).
Frontend
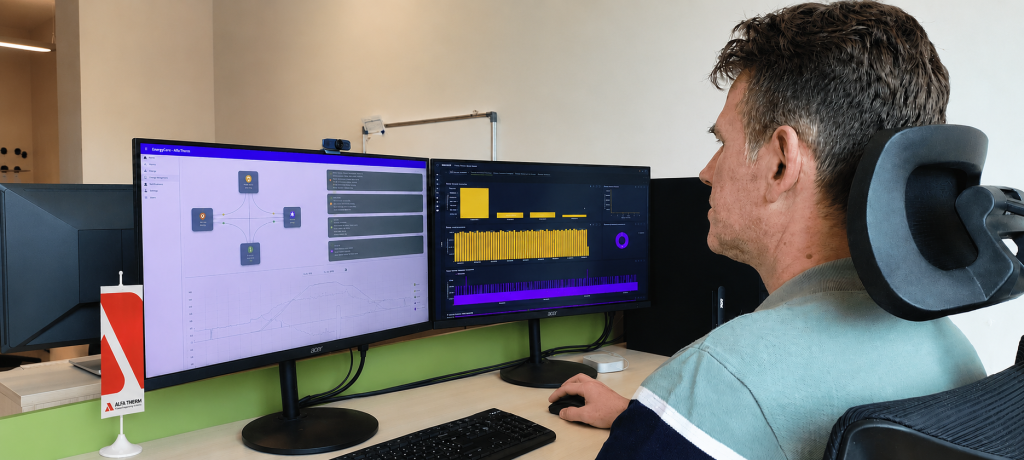
The frontend interface (user application and control panel) of EnergyCore is a visual and interactive layer that connects the user to complex energy processes that take place in the background. Its role is not only to display data, but also to intuitively guide users through energy flows, savings and system performances.
In the frontend interface, you can see the current distribution of electricity between the grid, the solar power plant, the battery and the building. The visualization animates the movement of energy between these 4 units in real time through small colored circles that move along gray lines. The example above describes one moment that shows that a solar power plant produces 63.8 kW. The needs of the building are 92.8 kW, and the rest is taken partly from the 17 kW battery and partly from the 12 kW network.
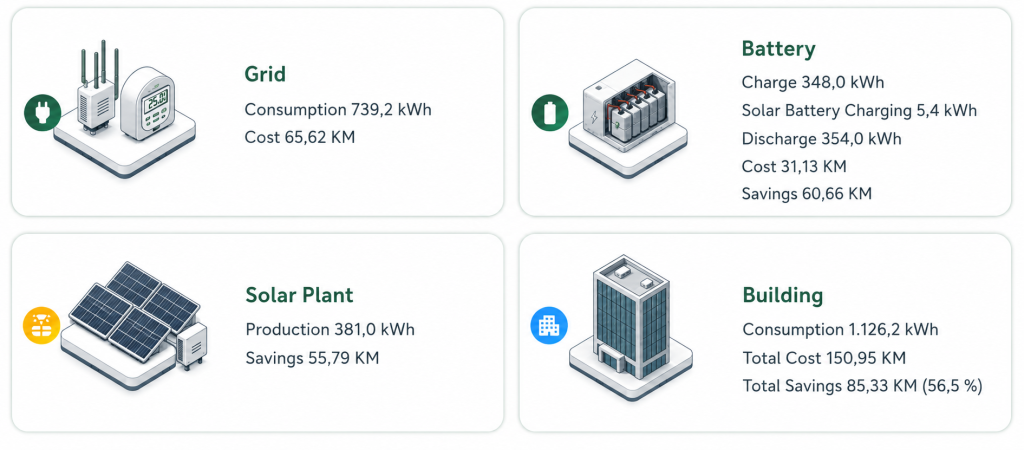
In addition to this, the frontend interface shows the statistics of electricity production and consumption in the given period. The following picture shows the statistics for one day.
It is evident that the needs of the building were 1,126.2 kWh with a cost of 150.95 BAM that day. Thanks to the photovoltaic power plant and the optimization of battery operation, 739.2 kWh was withdrawn from the grid that day at a cost of 65.62 BAM.
With this, we saved 56.5% of the electricity cost that day or 85.33 BAM. In addition to this daily savings in electricity consumption, the battery allows us to reduce the power engaged throughout the month.
Structure and functionality:
- The frontend was developed as a web application available on computers, tablets, and mobile devices.
- It uses the modern framework, which allows you to dynamically updating of data without the demand to refresh the page.
- Communication with backend services takes place via REST API calls, which ensures the display of the latest values of production, consumption and battery status.
Visualization of energy flows:
- The main representation of the frontend interface is an interactive diagram of a microenergy network that connects four units: the grid, the solar power plant, the battery and the building.
- The flow of energy is presented using animated colored circles that move along lines between the components – blue circles indicate energy from the grid, yellow circles show energy from the solar, and green circles mark energy from the battery.
- At any time, the user can see the current power (kW) of each component and the direction of energy movement.
Statistics & Analytics:
- The frontend shows daily, weekly and monthly statistics on electricity consumption and production.
- Graphic models include:
- Timeline diagrams of consumption and production by hour,
- Users can filter the data by date.
Predictions and AI in the interface:
- The frontend shows a prediction of solar production, based on an AI model that uses GHI data, and consumption for the next day.
- The predictions of the solar power plant are shown as purple lines on the graph, while the actual measurements are shown in yellow – so the user can compare the accuracy of the model and see trends.
- When the AI model detects a change in weather conditions (e.g., cloudiness), the interface automatically displays a new battery charging strategy.
User Experience and Interaction:
- The interface is designed in such a way that it does not require great technical knowledge – data is displayed simply and visually.
- The user can manually activate the battery modes (e.g. “maximum storage”, “optimized charging”) or let the system run in automatic AI mode.
- Information panels have been installed that show savings in BAM/€ and the percentage of cost reduction.
Security and availability:
- All data is displayed in real time, but historical records can be retrieved from the database for performance analysis.
- The system is optimized to operate in both on-premises and cloud modes, allowing for remote monitoring and management.
A frontend isn’t just a representation of data – it’s a decision-making tool. By combining visual analytics, AI predictions, and interactive design, Alfa Therm has created an interface that allows users to manage energy as a resource, not just to consume it. This achieves complete transparency, control and understanding of the energy system.
Energy Management System Results and Economic Viability
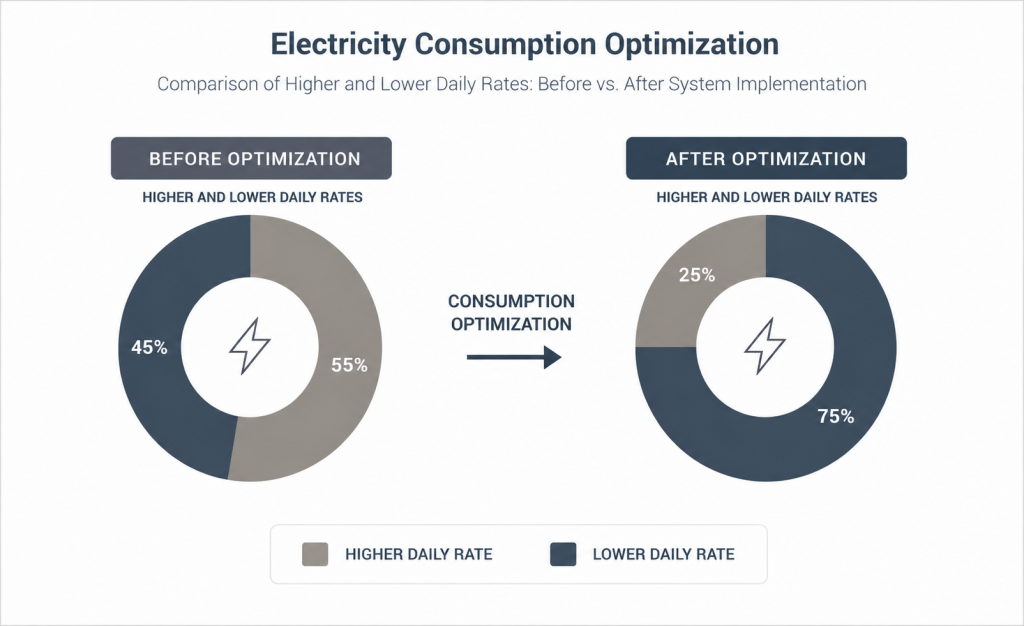
The implementation of this system has brought radical changes in our energy profile. Before the installation of the battery, the consumption ratio in the higher and lower tariff was on average in the last 3 years (2023, 2025 and 2025) higher tariff 45 % : lower tariff 55 %. In 2026, this ratio is higher tariff 25% : lower tariff 75%. The change in the tariff ratio clearly shows that the system has redirected consumption to cheaper hours, which represents a double benefit – cost reduction and the power grid relieving during periods of peak consumption.
The main benefits include:
- Reduction of bills: On specific daily samples, savings of over 50% are visible ( if we compare to the system without optimization ).
- Return on investment (ROI): At current prices, the ROI of a battery on our building is only 5 years. According to the expected increase in electricity prices in the future, this period will be further shortened.
- Increasing the efficiency of the solar power plant: The power plant is intended to be used for self-consumption, which means that until now we had to cut all the surpluses at the level of the inverter, although we had the potential for higher production. Now we can store these surpluses in the battery system and use them as needed. With this, we have increased the efficiency of the photovoltaic power plant by 8%, which has also reduced the payback time of the investment by one year.
- Maximum utilization: Since we operate in self-consumption mode, the battery allows us to use every kilowatt-hour produced from our own power plant.
- The system does not only reduce costs, but it also reduces CO₂ emissions because solar energy is used to the maximum.
- Thanks to the battery system and generator, the building has additional energy security and resistance in power outages.
- The system can be upgraded by integrating electric vehicles as additional energy storage (Vehicle-to-Grid concept).
Conclusion
This project demonstrates that the true value of an energy system lies not in its individual components, but also in how effectively they are integrated and intelligently managed. A photovoltaic system cannot make full use of surplus generation without battery storage, while a battery without intelligent control cannot deliver its full technical and financial potential.
Only when the system predict renewable energy production, analyse consumption patterns and make optimal decisions in real time can all hardware components operate as one cohesive and financially efficient energy ecosystem.
This is the idea behind EnergyCore – our proprietary, modular and scalable platform for intelligent energy management. Rather than being developed for a single facility, EnergyCore provides a flexible technological foundation that can be adapted to manufacturing plants, office buildings, hotels, shopping centres, logistics facilities and data centres. Its algorithms can be configured to reflect the specific energy profile of each site.
For us, the development of Energy Core is an ongoing process. Following the successful implementation of a system for optimising electricity generation and storage, our development team is working on new capabilities designed to further improve the energy efficiency and flexibility of buildings and facilities.
Key areas of development include:
- Predictive control of mechanical systems (AI-powered HVAC).
Predictive models will be connected directly to heat pump and ventilation controls. Instead of relying solely on solar irradiation data, the system will use forecasts and the building’s thermal inertia to determine in advance when and to what extent buffer tanks should be heated or cooled. This allows surplus solar energy to be stored as thermal energy, rather than exclusively as electricity in the battery. - Integration of smart EV chargers and Vehicle-to-Grid (V2G) technology.
Within a microgrid, electric vehicles are no longer just energy consumers. Through Vehicle-to-Grid technology, they can function as mobile energy storage units, returning electricity to the building when demand is high or additional flexibility is required. - Automated energy trading algorithms.
Software support for participation in local electricity markets will enable the system to autonomously purchase, store or sell energy at the most financially advantageous times. At the same time, it will help prepare our clients for full market liberalisation and emerging models of energy resource management.
Energy independence is not a fixed destination, but a continuous process of optimisation. By developing our own software, testing it under real operating conditions and expanding our in-house expertise, Alfa Therm does more than follow industry trends – we create solutions that deliver measurable results and tangible value.
Would you like to discover your facility’s energy-saving potential?
Every facility has a unique energy profile, shaped by its consumption patterns, tariff structure and the way energy is used. That is why we do not offer one-size-fits-all solutions. Each Energy Management system is designed around a detailed analysis of real data and the specific operational requirements of the client.
Our engineering team will assess your current energy performance, estimate the potential savings and recommend the optimal system configuration – whether that involves a photovoltaic power plant, battery storage, an Energy Management platform or a fully integrated solution.
For an initial assessment, the only things required are your electricity bills from the past 12 months and some basic information about the facility.
Effective optimisation always begins with a high-quality analysis.
Request an assessment of your facility’s energy potential and discover how integrating energy generation, storage and intelligent management can deliver measurable savings and greater long-term energy independence.
